
Overview
The quick ratio is one of the key liquidity ratios used by analysts. It is simple to understand and a widely used measure to analyze the liquidity of a company.
Generally, any quick ratio above 1 will be considered reasonable. However, benchmarking is a great tool to analyze the liquidity of a company.
Analysts can use the average quick ratio by industry to compare and benchmark the performance and liquidity of any company.
Let us discuss the quick ratio, how to calculate it, and how we can perform the benchmarking against industry averages.
What is the Quick Ratio?
The quick ratio measures a company’s ability to pay its current liabilities through its current assets. It is the measure of the short-term liquidity of a company.
Current assets include cash, cash equivalents, accounts receivable, and marketable securities. Only those marketable securities are included in the quick ratio calculation that can be converted to cash within 90 days.
A company’s current liabilities include short-term bank loans, accounts payable, immediate taxes payable, and the current portion of long-term debts.
The current or liquid assets are all items that can be converted to cash quickly. Cash and cash equivalents are the most liquid assets in that sense. Similarly, bank drafts, deposit certificates, and T-bills are a form of liquid assets as well.
How to Calculate Quick Ratio?
The quick ratio is a simple measure to calculate by formula. However, it requires careful attention when including current assets and current liabilities in the formula.
The quick ratio formula is given below.
Quick Ratio = Current Assets / Current Liabilities
Where,
- Current assets including Cash, Cash equivalents, Accounts Receivable, and Marketable Securities.
- Current Liabilities including Short-term Loans, tax payable, Interest payable on long-term loans, accounts payable.
In short, assets that can be converted to cash quickly will be included in the calculation. Similarly, liabilities that are due within 90 days should also be included in the formula.
Important Note:
The inclusion of accounts receivable in the quick ratio calculation is always debated. For clarity, only those accounts receivable should be included that can be collected under 90 days.
Inventory should also be excluded from the quick ratio formula. As it may take more than 90 days to convert the inventory from raw material to finished goods and sales.
Working Examples
Let us consider a real-world example to calculate the quick ratio.
The following is a snapshot of Amazon’s balance sheet from the annual reports for the year ended 2020.
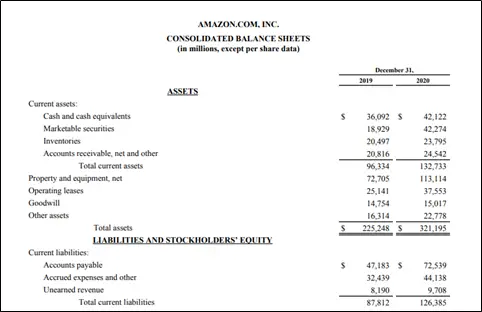
For the Year ended 2020:
Current Assets = Cash and Cash Equivalents + Marketable Securities + Accounts Receivable
Current Assets = 42,122 + 42,274 + 24,542 = $ 108,938 (in millions)
Current Liabilities = $ 126,385 (in millions)
Quick Ratio = Current Assets / Current Liabilities
Quick Ratio = 108,938/126,385 = 0.86.
Similarly, we can calculate the quick ratio of Amazon for the previous year 2019 using the given figures.
For the Year ended 2019:
Current Assets = Cash and Cash Equivalents + Marketable Securities + Accounts Receivable
Current Assets = 36,092 + 18,929 + 20,816 = $ 75,837 (in millions)
Current Liabilities = $ 87,812 (in millions)
Quick Ratio = Current Assets / Current Liabilities
Quick Ratio = 75,837/87,812 = 0.86
Average Quick Ratio by Industry
Like any other financial performance metric, the quick ratio also varies by industry. The average quick ratio by industry can be calculated using several types of data sets available.
One of such ways is to look at the quick ratios of the listed companies in different industries collectively. It can give us an idea of how these companies are performing against a specific measure.
The quick ratios for the top 10 performing industries for Q3 2021 are given below.
| Rank | Industry | Quick Ratio |
| 1 | Technology | 2.12 |
| 2 | Capital Goods | 1.87 |
| 3 | Consumer Discretionary | 1.57 |
| 4 | Financial | 1.54 |
| 5 | Energy | 0.72 |
| 6 | Services | 0.55 |
| 7 | Transportation | 0.53 |
| 8 | Retail | 0.38 |
| 9 | Consumer Non-cyclic | 0.22 |
| 10 | Conglomerates | 0.21 |
Similarly, we can also analyze the quick ratios of some industries with lower ranks.
| Rank | Industry | Quick Ratio |
| 1 | Basic Materials | 0.17 |
| 2 | Utilities | 0.17 |
| 3 | Health Care | 0.20 |
| 4 | Conglomerates | 0.21 |
| 5 | Consumer Non-cyclic | 0.22 |
The total market quick ratio for the same period is 0.66. We can also use several other metrics to evaluate the industry trends.
For instance, the S&P 500’s quick ratio for the current quarter is 0.71.
How to Use the Quick Ratio for Benchmarking?
The quick ratio is an important liquidity measure. It can be used for performance benchmarking by internal users such as employees and managers as well as external users like shareholders and investors of a company.
For Internal Users
Managers can use the quick ratio to analyze the short-term liquidity of the company. The best use can be to analyze it through the trend analysis.
Trend analysis can reveal the improvement or deterioration in liquidity of the company. It can reveal year-on-year quick ratio changes.
Digging deeper, managers can also evaluate which item of the equation has the bigger impact on the final result. For instance, in our working example above, Amazon has kept its quick ratio at 0.86 for two consecutive years.
For External Users
Investors and shareholders can also use the quick ratio to analyze the ability of a company to cover its short-term liabilities with its current assets.
Using our example, although Amazon’s quick ratio is below 1 for two consecutive years, it is still a strong, quick ratio. When we compare it with the total market quick ratio of 0.66, it is clear that Amazon has a healthy quick ratio.
What is a Good Quick Ratio?
Generally, the higher the quick ratio, the better it is for any company. However, stakeholders such as creditors and shareholders may think there is a lack of investment planning if they hold too much in their current assets.
A quick ratio of above 1 means the company has more current assets than its current liabilities. Similarly, a ratio of 1.0 means the company has the same amount of current assets and current liabilities.
A quick ratio below 1.0 shows the company has more current liabilities than its current assets. However, a below 1.0 quick ratio does not always depict an alarming situation.
As discussed earlier, a standalone figure does not reveal the full picture. It is pertinent to compare the quick ratio with the industry averages. Also, the comparison should be made within the same industry and sub-sector analysis whenever possible.
As with any other accounting measure, the quick ratio can be adjusted with different accounting treatments. Hence, it is important to evaluate the line items included in the calculation carefully as well.
Concluding Remarks
The quick ratio in the short term defines the liquidity of a company. Comparing it against the industry averages and trend analysis can reveal useful information about a company’s liquidity.
For fair comparisons, analysts must compare industry averages of similar companies in size and sub-sector. However, a company can set benchmarking targets for the best-performing companies in any industry.
Generally, a quick ratio higher than 1.0 is good. However, as we have seen in the Amazon example, if a company has a strong financial performance overall and it possesses significant assets, a quick ratio less than 1.0 may not be as bad either.