
Overview
Profit margins are the bottom line of any business. Investors and business managers compare profit margins with industry averages.
Some industries have high average profit margins, for example, the accounting and finance industry has typically higher profit margins around 18-20%. However, it’s important to remember that profit margins vary by industry.
Analysts must also consider other factors while evaluating profit margins for benchmarking. Profit margins have different variations, each with different implications.
Let us discuss different types of profit margins, average profit margins by industry, and see what is a good profit margin ratio.
What are the Different Types of Profit Margin?
Profit margin ratios come with different variations. Each measure offers different results and information.
Gross Profit Margin
Gross profit is sales minus the cost of goods sold (COGS). The COGS include direct material, direct labor, and other direct product costs.
Gross Profit Margin = (Revenue – Cost of Goods Sold)/(Revenue) × 100
Gross profit margin is used by internal stakeholders of a business; managers and employees.
Example
Let us consider a real-world example to calculate the gross profit margin. The following is a snapshot of the consolidated income statement of Amazon (AMZN) for the year ended 2020.
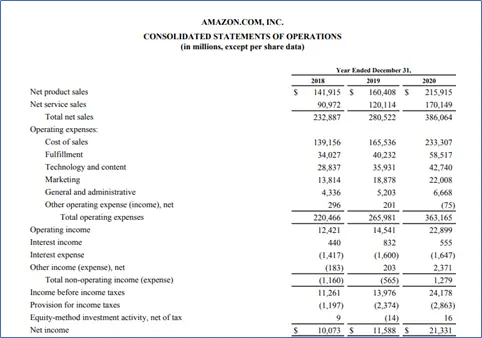
Gross Profit Margin = (Revenue – Cost of Goods Sold)/(Revenue) × 100
Gross Profit Margin = (386,064 – 233,307)/ (386,064) × 100
Gross Profit Margin = 39.56%
Operating Profit Margin
Operating profit deducts operating expenses from the gross profit. It can be calculated as:
Operating Profit = (Operating Income / Net Sales) × 100
Operating income is gross profit minus operating expenses such as admin, selling, marketing, and other business operating expenses.
Example:
Continuing with our example above, let us calculate the operating profit margin of Amazon.
Operating Profit = (Operating Income / Net Sales) × 100
Operating Profit = (22,899 / 386,064) × 100
Operating Profit = 5.93%
Pre-Tax Profit Margin
Pre-tax profit is a variation of operating profit. It deducts depreciation, amortization, and includes other income (loss).
Pre-Tax Profit Margin = (Earnings Before Tax / Net Revenue) × 100
Example:
We’ll use the same data to calculate the pre-tax profit margin of Amazon.
Pre-Tax Profit Margin = (Earnings Before Tax / Net Revenue) × 100
Pre-Tax Profit Margin = (24,178 / 386,064) × 100
Pre-Tax Profit Margin = 6.26%
Net Profit Margin
Net profit is the profit left after paying for COGS, operating costs, depreciation, taxes, and interest costs of a business. In other words, it is the profit that the business either distributes to its shareholders in the form of dividends or keeps as retained earnings for business expansion.
Net Profit Margin = (Net Profit/Net Revenue) × 100
Net profit margin is the most widely used profitability measure. It is a suitable performance yardstick for shareholders, managers, and investors alike.
Example:
Finally, let us calculate the net profit margin of Amazon using the same available data.
Net Profit Margin = (Net Profit/Net Revenue) × 100
Net Profit Margin = (21,331/386,064) × 100
Net Profit Margin = 5.52%
What is the Average Profit Margin by Industry?
As mentioned earlier, profit margins vary by industry. Also, economic conditions such as recessions affect the profitability and growth of different industries with varying effects.
For instance, in the current economic recession due to the COVID-19 pandemic, some industries such as pharma and IT will show increased profit margins. Some of that boom may be cyclic and may not be generalized for the industry in the long run.
Important:
The industry profit margin average will vary by the profit margin type as well. For instance, some industries such as IT show the highest gross profit margins. Service industries are likely to show higher gross profit margins as compared to product industries such as the retail industry.
Gross Profit Margins by Industry
The figures below are for the listed companies who have announced their quarterly results for the current financial year 2021. The performance evaluation is based on the last twelve months trailing basis.
Gross Profit Margins by Industry: Q3 2021 (Twelve Months Trailing)
| Rank | Industry | Gross Profit Margin |
| 1 | Technology | 93.91% |
| 2 | Transportation | 92.25% |
| 3 | Services | 69.85% |
| 4 | Utilities | 59.34% |
| 5 | Financial | 56.84% |
| 6 | Energy | 49.51% |
| 7 | Consumer Non-Cyclic | 48.16% |
| 8 | Consumer Discretionary | 46.66% |
| 9 | Basic Materials | 32.40% |
| 10 | Conglomerates | 31.30% |
Operating Profit Margins by Industry
Operating profits by the industry for the current year 2021 are shown below.
Operating Profit Margins by Industry: Q3 2021 (Twelve Months Trailing)
| Rank | Industry | Gross Profit Margin |
| 1 | Financial | 26.79 % |
| 2 | Capital Goods | 22.85 % |
| 3 | Technology | 19.21 % |
| 4 | Utilities | 15.71 % |
| 5 | Consumer Discretionary | 15.18 % |
| 6 | Consumer Non-Cyclic | 15.10 % |
| 7 | Conglomerates | 9.56 % |
| 8 | Basic Material | 8.67 % |
| 9 | Transportation | 6.56 % |
| 10 | Energy | 6.37 % |
Pre-Tax Margins by Industry
Now let us glance at the pre-tax profit margins by the industry for the Q3 of 2021 with twelve months trailing figures.
Pre-Tax Profit Margins by Industry: Q3 2021 (Twelve Months Trailing)
| Rank | Industry | Gross Profit Margin |
| 1 | Financial | 29.05 % |
| 2 | Capital Goods | 24.73 % |
| 3 | Consumer Discretionary | 16.68 % |
| 4 | Technology | 15.71 % |
| 5 | Consumer Non-Cyclic | 13.77 % |
| 6 | Utilities | 13.60 % |
| 7 | Basic Materials | 9.53 % |
| 8 | Transportation | 8.98 % |
| 9 | Conglomerates | 6.02 % |
| 10 | Energy | 4.84 % |
Net Profit Margins
Now let us take a look at the net profit margins by industry and see which industry has the highest net profit margins cumulatively.
Net Profit Margins by Industry: Q3 2021 (Twelve Months Trailing)
| Rank | Industry | Net Profit Margin |
| 1 | Financial | 23.81 % |
| 2 | Capital Goods | 19.21 % |
| 3 | Consumer Discretionary | 14.93 % |
| 4 | Technology | 12.28 % |
| 5 | Consumer Non-Cyclical | 10.03 % |
| 6 | Utilities | 9.05 % |
| 7 | Basic Materials | 6.71 % |
| 8 | Energy | 5.85 % |
| 9 | Transportation | 5.05 % |
| 10 | Conglomerates | 4.03 % |
What is a Good Profit Margin?
Profit margins are profitability ratios that show only percentage figures. As we can see the profit margin by industry vary drastically for different types. For instance, the technology sector has the highest gross profit margin ratio.
The technology sector usually has low costs of goods sold. However, its operating and net profit margins are lower as compared to other industries. Thus, there is no blanket rule to determine what is a good profit margin.
How to Use Profit Margin for Benchmarking?
Profit margins should be compared within the same industries. Also, it is important to consider the size and maturity of the companies when comparing profit margins.
Benchmarking is a good practice that provides useful comparison analysis. However, results should be interpreted carefully. Special circumstances such as cyclic sales, economic recessions, or government regulations can affect the profits of companies in a particular industry or geography.
For example, the current net profit margin in the technology sector is around 12% for Q3 2021. Whereas in our working example, Amazon had a net profit margin of only 5.52%. It doesn’t imply Amazon is underperforming as compared to the industry as Amazon’s net profits in dollar value will be significantly higher than other tech firms around the world.
As an example, the S&P 500’s net margin for Q3 2021 is 5.31%. It means Amazon is performing around and above its index average.
In a nutshell, profit margin ratios require detailed interpretation. Also, it’s wise to consider the trend analysis when analyzing profit margin ratios. Benchmarking should also be carried out for the historic performance analysis of a company or industry.
References for Research Work: