
A chart of accounts or COA is just like an organizational chart, but with one major difference and that is it shows financial accounts instead of the position of people in an organization.
A chart of accounts provides great details of each of the accounts in a company’s balance sheet. It divides and sub-divides assets, liabilities, and shareholders equity so it makes it easier to track every account. Sometimes, it can be difficult to assess a company’s financial position just from its balance sheets, so the Chart of Accounts proves to be a very useful graphic financial tool under these conditions.
How does it work?
Consider for the example a business ABC. It has prepared a balance sheet in the traditional form, but the investors are demanding that it is extremely difficult to assess the correct position from the balance sheet and are demanding a much more clear and concise picture of the financial situation of the Business ABC.
So, the Business ABC prepares the Chart of Accounts. In very simple, yet beautiful graphics, it has divided assets into current and non-current assets, liabilities into current and non-current liabilities, and shareholders equity into major shareholders. These are further subdivided into accounts, and each one is showing the value that it holds. It provides a very clear picture of the financial condition of the Business ABC. All the investors are very happy with the presentation.
This was done through the conversion of a complicated balance sheet into a chart of accounts.
Example

Figure 1: A simple example of a chart of the account
A simple example is shown in figure 1. This is how a chart of the accounts may look like. The assets, liabilities, equity, income, and expenses are all sub-divided into a different account.
Each account is classified into sub-divisions. For example, the asset is divided into checking account, inventory, and equipment. Similarly, equity is divided into the owner’s invested funds and retained earnings. The equity shown in figure 1 is listed for a private company.
Main parts of the Chart of the Accounts
The main parts of the chart of the accounts are given below in figure 2:
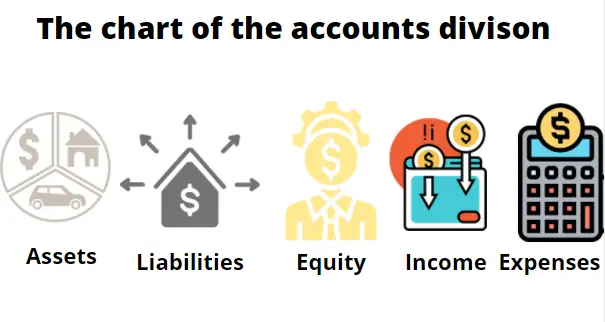
Figure 2: Five main parts of chart of the accounts
The five main parts of the chart of the accounts given in figure 2 are assets, liabilities, equity, income, expenses. These all are five major divisions which are further divided into more sub-divisions. The details about all the five main divisions are given below:
Assets
An asset is a resource, which is owned by a business. There exist multiple asset classes with their own sub-classes. Some examples of assets that a business can own are equipment, land, bonds, intellectual property, and contracts. The more assets a company owns, the more sub-divisions appear in the chart of the accounts
The companies would like to own more assets, so they appear more attractive to investors.
The assets are divided into current and non-current assets. The current assets are those which can be quickly monetized, and non-current assets are those which cannot be quickly monetized.
Liabilities
Liabilities are obligations of a business. These can be loan payments, contractual obligations, bonds, and rent. Just like assets, liabilities are also divided into current and non-current liabilities. In the chart of accounts, assets come after liabilities
Current liabilities are those obligations that are due within a year, whereas non-current liabilities are those obligations that are due after more than a year.
Shareholders’ equity
The shareholder’s equity is the amount of ownership of the owner in a business. For businesses that have a single ownership structure or their ownership structure is not a limited liabilities company or LLC, the shareholder’s equity is referred to as owners equity.
Basically, equity means ownership. How much does a business or shareholders own a business? In the COA, It comes after the liabilities section.
Income
Income is the amount of money generated by a business by providing products and services to its customers. The income is a standard metric of evaluation of a company’s financial health. When investors talk about growth in companies’ earnings, they are always talking about income growth as compared to the previous quarter or previous year. The higher the income growth, the much better the financial position the business is in.
In the chart of the accounts, income comes after liabilities. This section of the chart of the accounts may be further divided into sub-divisions such as net income which means profit. The gross income is another sub-division used in the income section of the COA, which means the total revenue the company generated within a single timeline.
Expenses
The expenses are the costs a business endures when producing a product or service for selling to its customers. These costs include raw materials purchase cost, employee salaries, rent, lease, utilities, interest payments, licensing deals, and much more. The lower the expenses are, the higher the net income is, and the more profitable the business is.
The expenses are the last part of the chart of the accounts. It can be reasonably inferred that expenses also contain sub-divisions. The expenses can be divided into operating and non-operating expenses.
The operating expenses are directly related to the operations of the company for the product or service that it is producing, whereas the non-operating expenses come from those expenses which are not directly related to the operations of the company.
Importance of chart of the accounts
The chart of the accounts is a very important tool. Its importance is noted in the following notes:
- It provides a clear picture of the balance sheet.
- The graphics of the chart of the Accounts make it much clearer than a complex balance sheet to understand the financial position of the company.
- The chart of the accounts can also be used for each department separately. For example, sales department and Engineering department both can have a different chart of the account.
- It provides a clear cost and benefit analysis for each department of a single business.
Conclusion
Chart of the accounts is a very attractive financial tool developed to make it easy for investors to comprehend a company’s financial position by dividing a balance sheet into five main parts with its own sub-divisions. The COA is also a very useful tool for inner use by a company so it can compare the costs of the different departments to improve the efficiency of its operation.